
Digital marketing is competitive. Infographics are a great way to share your information in a new, distinctive, way. They’re essentially detailed information, or data, turned into easy-to-read graphics.
When to use
B2B companies, such as engineers, manufacturers, tech companies, and more, can use infographics to provide a visual aid to their often complex, highly technical, expertise. For example, if your company dedicated time and effort to conducting a study for a research paper, that data would be well suited as an infographic.
Why use
- People love visuals
- The brain processes visual information faster than text, thus infographics make it easier for the viewer to comprehend. Also, bright colors and charts are more likely to grab someone’s attention than a big block of text.
- Easily shared
- Infographics are popular for sharing on social media; it’s easier to download and repost an image than a body of a text from a blog. Additionally, infographics draw more attention on image-focused platforms like Pinterest and Instagram.
- Good for gated content
- Every good marketer knows that leads drive business. One of the best ways to capture leads is to share content on your website in exchange for contact information. This is called “gated content”. Gated content is typically white papers, survey results or another in-depth document written to provide critical industry information. However, infographics are perfect for gated content if you are providing information with a significant amount of proprietary data.
- Helpful for SEO link building
- SEO stands for Search Engine Optimization and it’s the process of trying to get your site to rank higher in the list of organic search results. One way to do this is by attaining off-site links, i.e., links back to your website from other websites. Infographics are perfect for off-site back links. If someone finds your infographic and likes it, they might republish it on their site and you could ask for a link back to your site. These backlinks will show the search engines that you’re creating useful content and you’ll gain importance and rank higher.
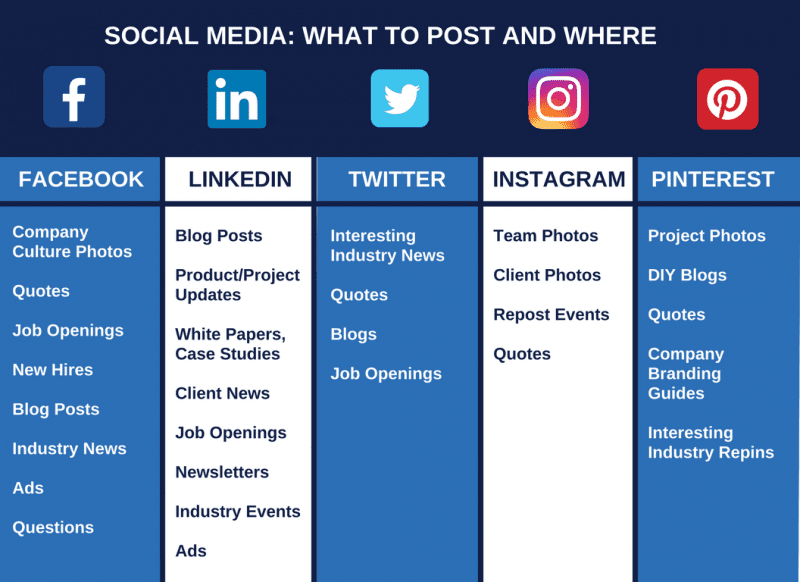
The information doesn’t have to be only numbers; it can be a list of thoughts that are easily consumed in a graphic format. We created the following chart and included it in one of our recent blogs about SEO in the Oil & Gas Industry.
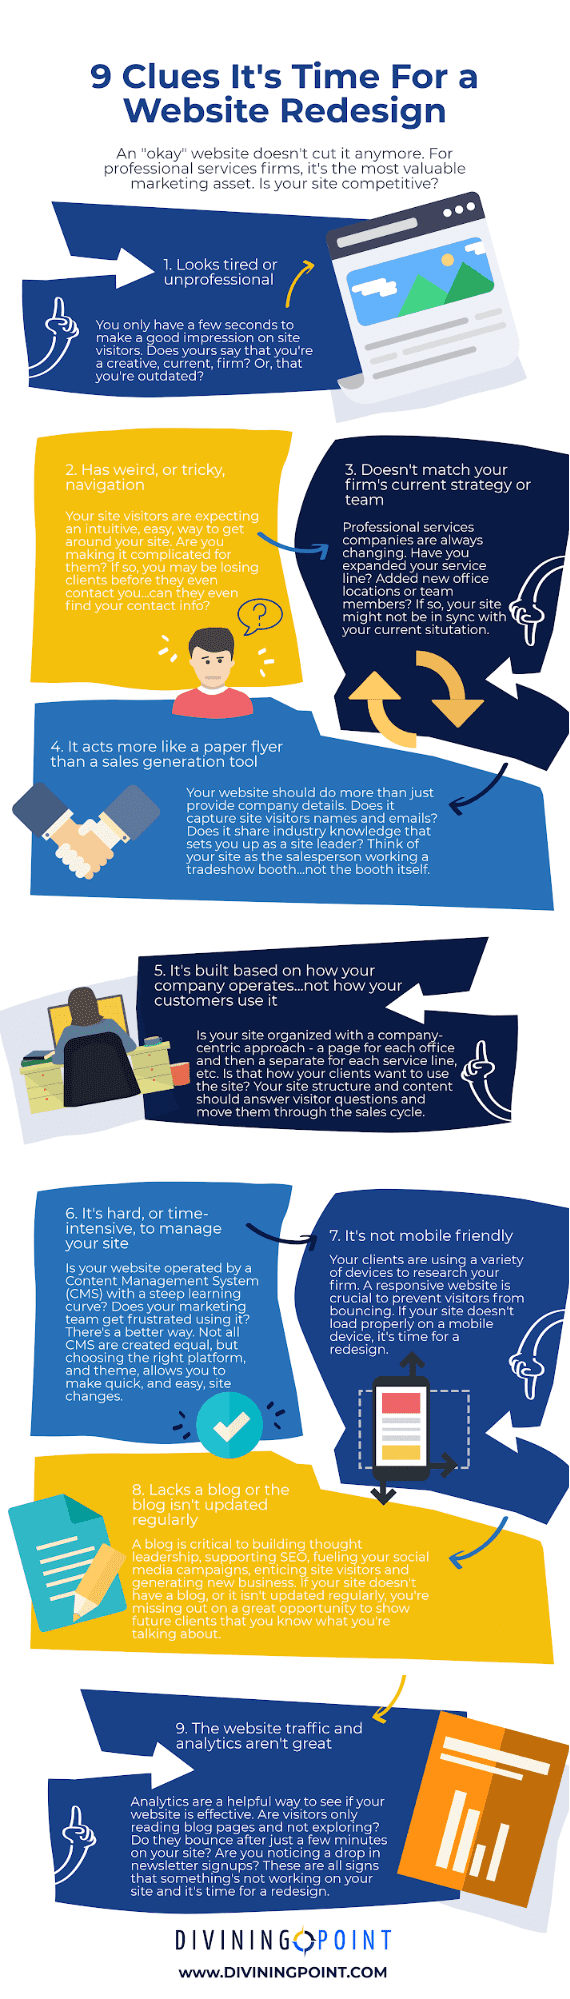
And, here’s an example of an infographic we created on deciding when to do a website redesign.
Infographics are popular, and if done well, they’ll keep your website visitors focused, entertained and coming back for more. They’re a handy way to share information that would otherwise be confusing, and maybe boring, to read. If you work in a technical industry, like engineering, manufacturing, or tech services, think of an infographic as a tool to be used to quickly convey your knowledge with your readers. You don’t have to share all of your expertise/data in the infographics…just enough to get them thinking and motivated to ask you for more.
Our design team has experience working with engineers, tech firms, and other B2B companies, to convert their useful data, or knowledge, into easily consumable infographics. Give us a call or send us a message with your infographic idea and we’d be happy to get started. And, remember, think outside of the box! Even research papers, or industry best practices, can be turned into interesting graphics.
Ready to take your business to the next level? Contact us. We’re here to help.